


Santa Clara County
Select the whole Bay Area, or your specific county, for an in-depth look at the state of workers in your area:
GOOD Jobs
Jobs
Barriers to quality, empowered jobs for working people in the Bay Area endanger the future of our economy.
While employment rates fail to show the quality of jobs workers have, the racial disparities in this simple measure can still be an important indicator of workforce equity. In Santa Clara County, about four in five adults are employed, with much smaller racial gaps than the region as a whole. One exception is that Pacific Islander adults are more likely than any other group to be employed, at 90 percent.
Universe includes the civilian, non-institutionalized population ages 25 through 64. Latinx include people of Hispanic origin of any race and all other groups exclude people of Hispanic origin. See data sources here: https://nationalequityatlas.org/RWB
Not all job creation is good job creation.
In Santa Clara County, middle-wage job growth has been very strong (92 percent from 1990-2021), a positive sign for economic mobility from lower-wage jobs. However, growth in high-wage jobs have grown much more slowly 19 percent over the same period). Improving job quality and protections for all workers in all sectors remains essential for building a more equitable and sustainable regional economy.
Universe includes all private-sector jobs covered by state unemployment insurance laws. See data sources here: https://nationalequityatlas.org/RWB

How are workers faring in the Bay Area?
The Bay Area is home to great wealth and opportunity, but neither is shared equally. Why do those inequities exist? And are we making progress in closing those gaps? What does all this mean for Bay Area working families, neighbors, and communities?
We asked our cross-sector Equity at Work Council to partner with the Bay Area Equity Atlas to use data to tell a more nuanced story about how workers are faring in our region. As a result of those efforts, we are excited to present the first ever State of Bay Area Workers tool, offering a well-rounded picture of work and workers in each Bay Area county and the Region as a whole. We hope community leaders, organizers, policymakers, funders and others will use this data to explore, learn, spark conversation, and make informed decisions about strategy, policy and practices that lead to the change we need.
Economic growth should benefit all workers and communities.
Bay Area decision-makers have implemented economic policies that created unprecedented wealth in our region for those in the highest wage jobs, at the expense of those in low and middle wage jobs.
Pay for the highest-earning workers in Santa Clara County has increased by 65 percent since 1990, while earned income has declined by 3 percent over the same period for those in the lowest-paid jobs.
In the 2022 Silicon Valley Pain Index conducted by San Jose State, it was discovered that 44% of the housing wealth in San Jose is owned by White individuals, despite them comprising only 35% of the population. On the other hand, Black individuals, who make up 3.2% of the population, only possess 1.3% of the housing wealth. Similarly, Latinx Americans, accounting for 24% of the population, own merely 12% of the housing wealth.
Universe includes civilian noninstitutionalized full-time wage and salary workers ages 25-64. See data sources here: https://nationalequityatlas.org/RWB
Worker power is the only time tested, scalable strategy to create family-sustaining jobs.
Strengthening unions and other forms of organizing that build collective power among working people is essential to improving job quality, and can increase the availability of a skilled workforce. Native American and Black workers in the Bay Area are most likely to belong to unions. But overall, more than five out of six workers in the region are not protected by union membership.
Universe includes employed wage and salary workers, age 15 or older. Latinx include people of Hispanic origin of any race and all other groups exclude people of Hispanic origin. See data sources here: https://nationalequityatlas.org/RWB
Eliminating barriers to employment and closing racial wage gaps could boost Santa Clara County’s economy by more than 30 percent.
The Bay Area is at a crossroads. We can either double down on the inequitable economic and employment trends of the past 40 years, or reimagine an economy that is powered by the full collective potential of our region.
In 2020 alone, employment barriers and pay inequities cost Santa Clara County’s economy an estimated $106 billion in unrealized GDP.
(GDP) Gross Domestic Product measures the dollar value of all goods and services produced in the region. GDP growth is in real terms (adjusted for inflation). Universe includes all people age 16 or older. See data sources here: https://nationalequityatlas.org/RWB
EQUITABLE Access
Access
Santa Clara County becomes more diverse every year. Economic opportunity does not.
70 percent of Santa Clara County residents are people of color. This diversity can be a cornerstone of a thriving Bay Area economy, if children, families, and working people of color are allowed to reach their full potential.
Universe includes all people ages 18-64. Latinx include people of Hispanic origin of any race and all other groups exclude people of Hispanic origin. Data are not available for some racial/ethnic groups due to insufficient sample size to produce reliable estimates. See data sources here: https://nationalequityatlas.org/RWB
Educational attainment is an important contributor to economic freedom. Persistent racial inequities in education must be eliminated.
About 56 percent of adults in Santa Clara County have at least a bachelor’s degree, compared to 49 percent regionwide. This includes 72 percent of Asian American and 65 percent of white adults, but just 19 percent of Latinx and 22 percent of Pacific Islander adults.
For more data on post-secondary education in Santa Clara County, check out California Competes’ Postsecondary to Prosperity Dashboard.
Universe includes all people ages 25 through 64. Latinx include people of Hispanic origin of any race and all other groups exclude people of Hispanic origin. Data are not available for some racial/ethnic groups due to insufficient sample size to produce reliable estimates. See data sources here: https://nationalequityatlas.org/RWB
How are workers faring in the Bay Area?
The Bay Area is home to great wealth and opportunity, but neither is shared equally. Why do those inequities exist? And are we making progress in closing those gaps? What does all this mean for Bay Area working families, neighbors, and communities?
We asked our cross-sector Equity at Work Council to partner with the Bay Area Equity Atlas to use data to tell a more nuanced story about how workers are faring in our region. As a result of those efforts, we are excited to present the first ever State of Bay Area Workers tool, offering a well-rounded picture of work and workers in each Bay Area county and the Region as a whole. We hope community leaders, organizers, policymakers, funders and others will use this data to explore, learn, spark conversation, and make informed decisions about strategy, policy and practices that lead to the change we need.
The Bay Area economy is controlled by those who benefit the most from the status quo; inequities preserve political power for the few.
On average, white workers in Santa Clara are paid about 21 percent more than the County’s median wage, while US- born Black workers are paid 26 percent less than the median, and US-born Latinx and Black immigrant workers are paid 35 percent less. At $17/hour, Latinx immigrants are paid the lowest median wages in Santa Clara County — half of the county median.
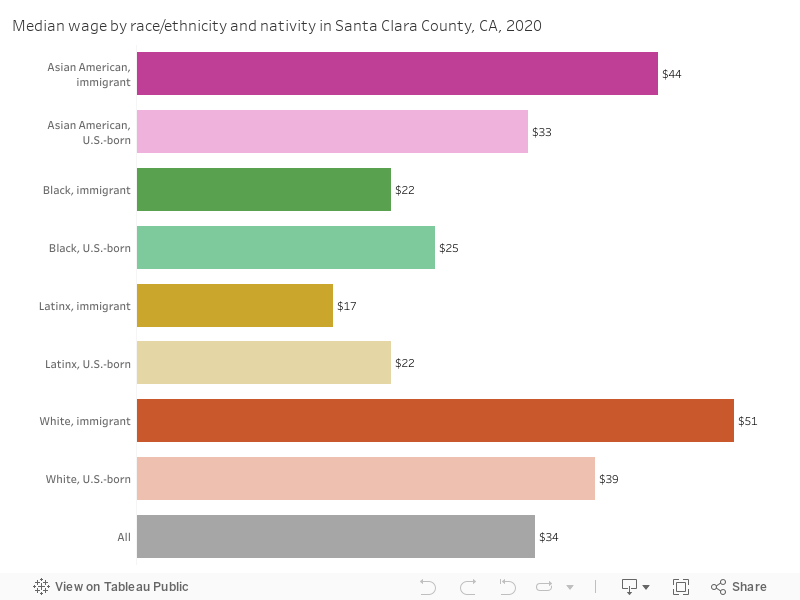
Universe includes civilian noninstitutional full-time wage and salary workers ages 25-64. Values are in 2019 dollars. Latinx include people of Hispanic origin of any race and all other groups exclude people of Hispanic origin. Data are not available for some racial/ethnic groups due to insufficient sample size to produce reliable estimates. See data sources here: https://nationalequityatlas.org/RWB
How much you get paid determines how much you can afford; just 62 percent of working people in Santa Clara County can afford basic family living expenses.
Only 31 percent of Latinx and 47 percent of Black full-time working people in the county are paid enough to cover the cost of living for a family of four with two full-time working adults, compared to 75 percent of their white counterparts.
Universe includes civilian noninstitutional full-time wage and salary workers ages 25-64. Latinx include people of Hispanic origin of any race and all other groups exclude people of Hispanic origin. Earning enough to meet basic needs is defined by the Family Needs Calculator for a household of 2 adults, one school-age child, and one preschool-age child in the county in which they reside. See data sources here: https://nationalequityatlas.org/RWB
Working people of color continue to be concentrated in lower-wage jobs.
Black and Latinx working people are crowded in occupations that tend to offer lower quality jobs, while white and Asian American working people are overrepresented in several high-paying fields.
In Santa Clara County, Latinx workers make up 24 percent of the overall workforce, but 51 percent of those in food preparation and serving jobs, and only 4 percent of those in computer and mathematical jobs.
Universe includes civilian noninstitutional workers age 16 or older; universe for total working age population includes all people ages 18-64. Latinx include people of Hispanic origin of any race and all other groups exclude people of Hispanic origin. Data are not available for some racial/ethnic groups due to insufficient sample size to produce reliable estimates. See data sources here: https://nationalequityatlas.org/RWB
AFFORDABLE Supports
Supports
Quality, empowered jobs are critical, but everyone must be able to compete for them.
Across all racial groups in Santa Clara County, labor force participation is highest for male-identifying people. Among female-identifying people, the gap is largest between Latinx and Asian American adults (70 percent labor force participation) and Black adults (76 percent). Among male-identifying people, the largest gap is also between Black workers and their Asian American counterparts, though in the opposite direction (79 and 89 percent, respectively).
To ensure all people have access to quality jobs, systemic and structural changes are needed that address bias in hiring and the inequitable availability of child care, transportation, and housing.
Universe includes the civilian, non-institutionalized population ages 25 through 64. The labor force includes those who are employed and those unemployed but actively looking for work. Latinx include people of Hispanic origin of any race and all other groups exclude people of Hispanic origin. Data are not available for some racial/ethnic groups due to insufficient sample size to produce reliable estimates. See data sources here: https://nationalequityatlas.org/RWB
The lack of Bay Area housing affordability is both a driver and a result of inequities in the Bay Area economy.
People of color, and especially women of color, shoulder the greatest burden of the lack of affordable housing in the Bay Area. Outrageous housing costs and unlivable wages force too many families to choose between paying rent, paying for other essential needs, or moving out of their communities. In Santa Clara County, 64 percent of renter households headed by Black women are rent-burdened, the highest rate among any other racial/ethnic and gender groups.
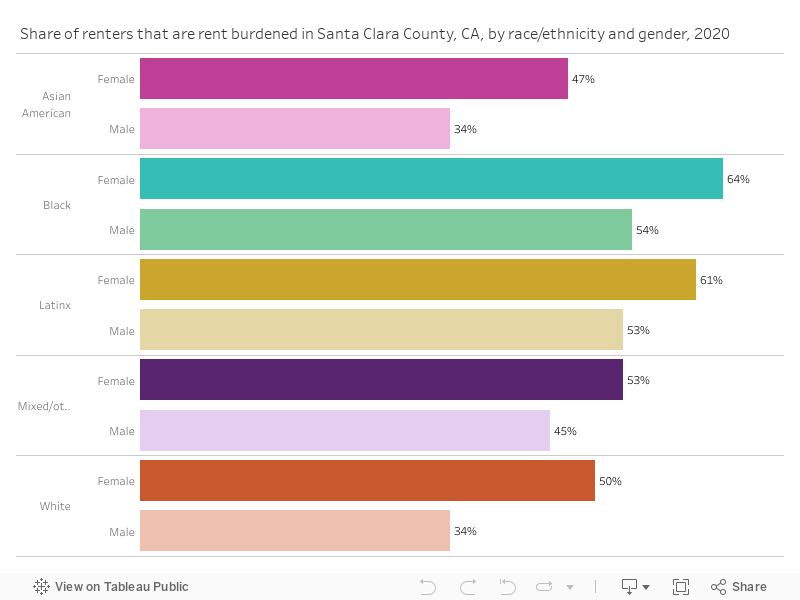
Universe includes renter-occupied households with cash rent. Rent burden is defined as spending more than 30 percent of income on housing costs. Latinx include people of Hispanic origin of any race and all other groups exclude people of Hispanic origin. Data are not available for some racial/ethnic groups due to insufficient sample size to produce reliable estimates. See data sources here: https://nationalequityatlas.org/RWB
How are workers faring in the Bay Area?
The Bay Area is home to great wealth and opportunity, but neither is shared equally. Why do those inequities exist? And are we making progress in closing those gaps? What does all this mean for Bay Area working families, neighbors, and communities?
We asked our cross-sector Equity at Work Council to partner with the Bay Area Equity Atlas to use data to tell a more nuanced story about how workers are faring in our region. As a result of those efforts, we are excited to present the first ever State of Bay Area Workers tool, offering a well-rounded picture of work and workers in each Bay Area county and the Region as a whole. We hope community leaders, organizers, policymakers, funders and others will use this data to explore, learn, spark conversation, and make informed decisions about strategy, policy and practices that lead to the change we need.
Many Bay Area working people face extremely long and expensive commutes resulting in less take-home pay, higher child care costs, and lower quality of life.
High housing costs in areas where jobs are most concentrated mean that low-income workers who rely on public transit have the longest average commutes in the Bay Area. About 7 percent of Black and Native American workers spend 90 minutes or more traveling to work, one way. All workers deserve access to safe and affordable transportation with a reasonable commute time. Not only are shorter commutes better for workers, they are also better for communities and the environment.
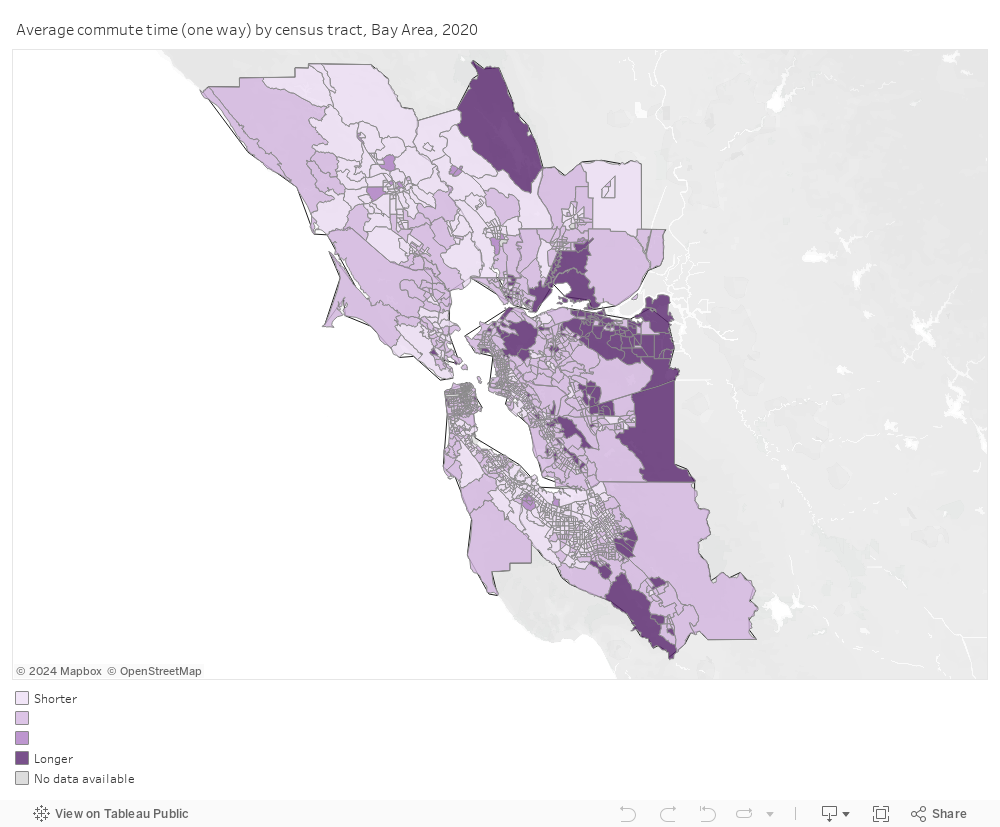
Universe includes all workers ages 16 and older who work outside of home. Data reflect a 2016-2020 average. See data sources here: https://nationalequityatlas.org/RWB
No one in the Bay Area should be without affordable health care.
Safe and healthy working people means healthy families and thriving businesses. Yet nearly one in ten Latinx residents in Santa Clara County do not have health insurance — more than three times the rate of their white counterparts.
Universe includes all people. Latinx include people of Hispanic origin of any race and all other groups exclude people of Hispanic origin. See data sources here: https://nationalequityatlas.org/RWB
For a diverse, prosperous and equitable future, our political leaders must reflect the Bay Area community.
People of color are not equitably represented in high-level elected offices, contributing to political and economic power imbalances. In Santa Clara County, people of color are two-thirds of the population and hold half of high-level elected offices. Increased economic and political power in communities of color can lead to a Bay Area that works for all of us.
Elected officials include county offices of supervisor or district attorney. See data sources here: https://nationalequityatlas.org/RWB